Hi, I'm Miretia, also known as WhiteCoatRabbit on GitHub.
I have developed an R package called "heatmap.SVG", and I would like to describe how to use this package in this article.
I apologize for not writing this in a vignette—I have a lot of images to illustrate the process, and writing it directly in R was quite challenging.
Now, let's get started!
p.s. The question mark shaped snake with stick is my logo! I sometimes change the stick as pen or crochet hook. :)
0. Why I developed this package
As a medical doctor and researcher, I frequently use heatmaps to visualize my results.
However, I didn't like the traditional rectangular format.
While it allows for displaying a lot of data at once, it isn't always intuitive at first glance.
This became especially apparent when I was working with anatomical data—I wanted to overlay my results directly onto an anatomical atlas.
I found ggseg package for brain area, but I couldn't find similar tools for other anatomical systems (e.g., the digestive system, teeth, etc.).
So I started developing heatmap.SVG for myself... and I'm happy to share it with you!
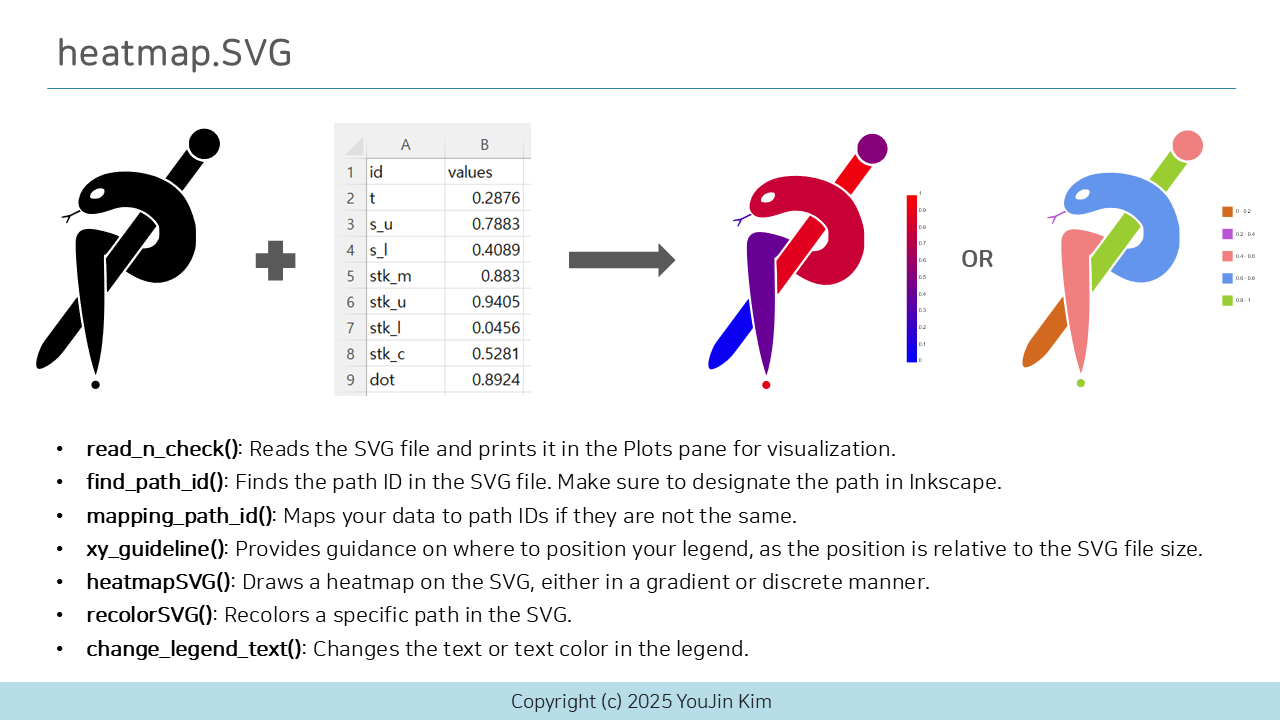
This package allows you to create heatmaps in custom shapes if you have svg file defining the shape.
In this tutorial, I'll demonstrate how to create a population heatmap of South Korea.
If you want example data, the map is from mapsvg and population data is from Korean Statistical Information Service.
1. Prepare SVG file
Before you start, you should have an SVG file with separate paths.
If the file doesn't have separate paths, you’ll need to create them.
You can use Inkscape to do that, a free vector graphics editor.
① If your file already contains separate objects: Use "Object to path", shortcut "Shift+Ctrl+C".
② If your file has clear boundaries but no paths: I use the paint tool to convert them into paths. (See the screenshot below.)
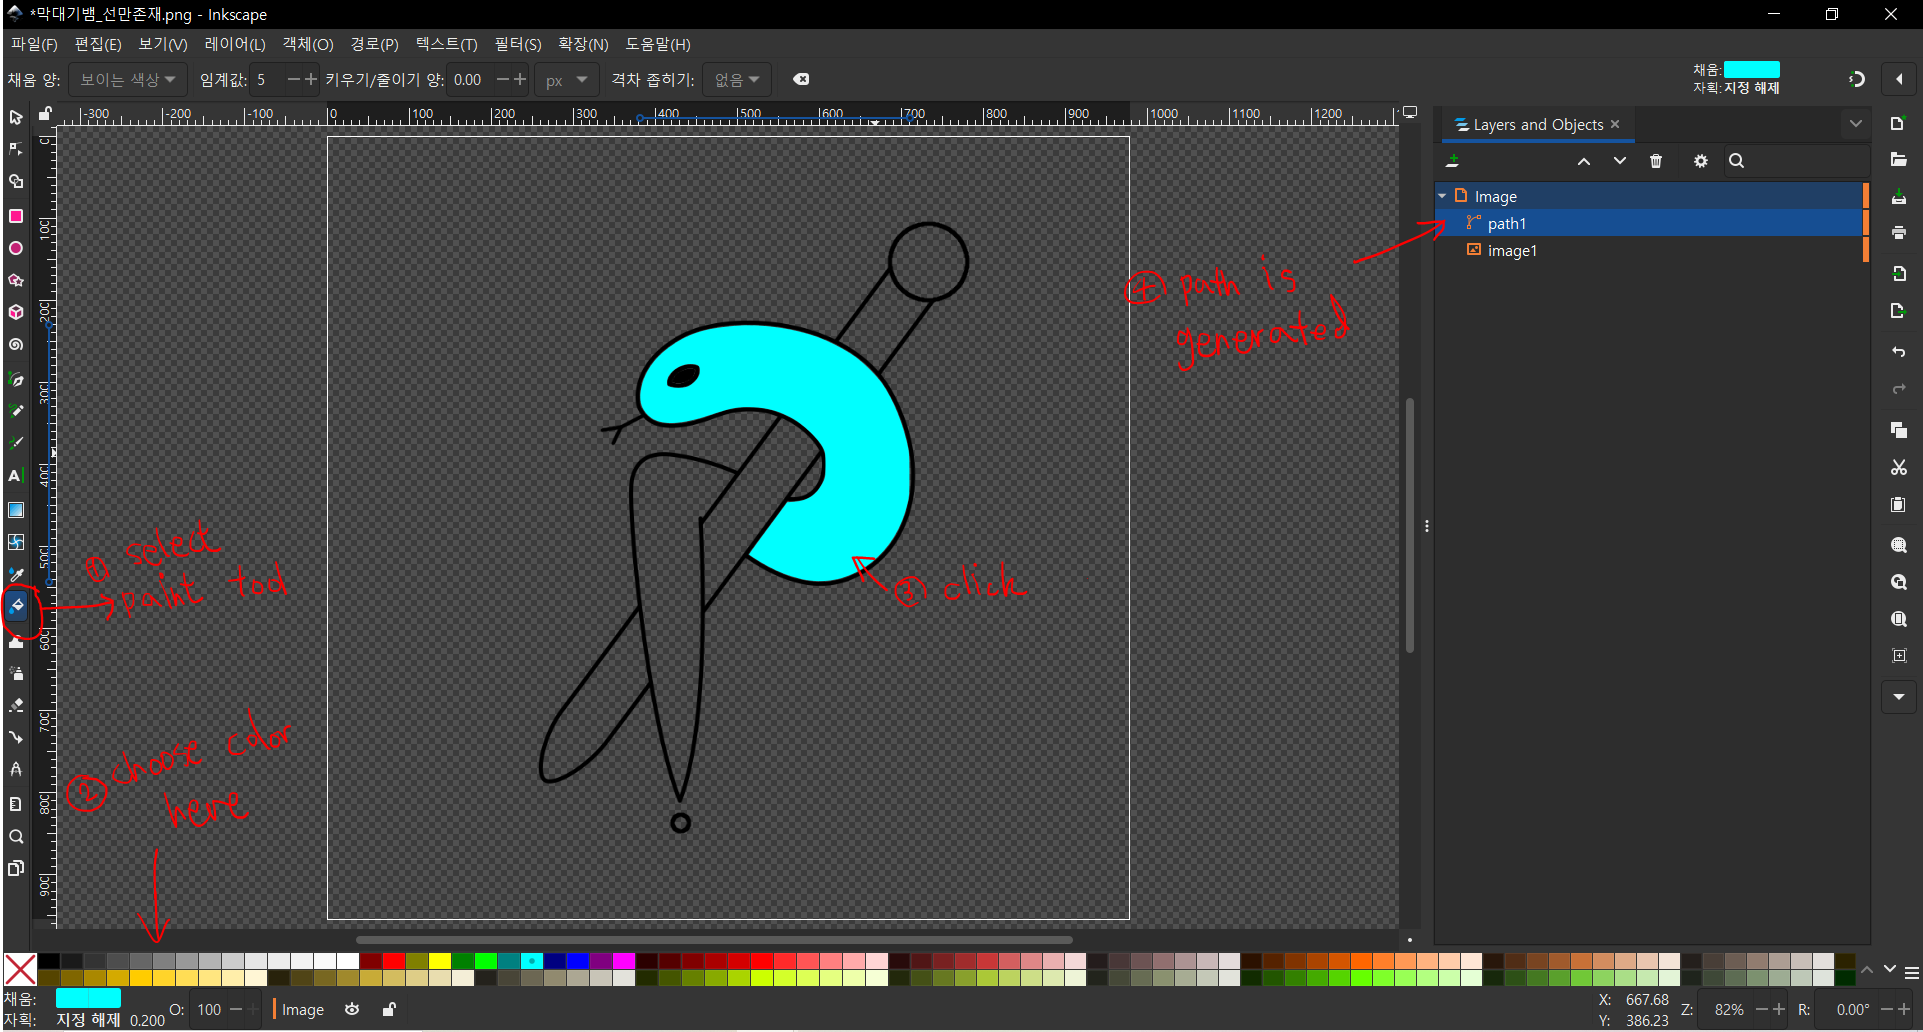

③ If your file doesn't offer separate object or clear boundaries....: I use pencil tool to draw boundaries.
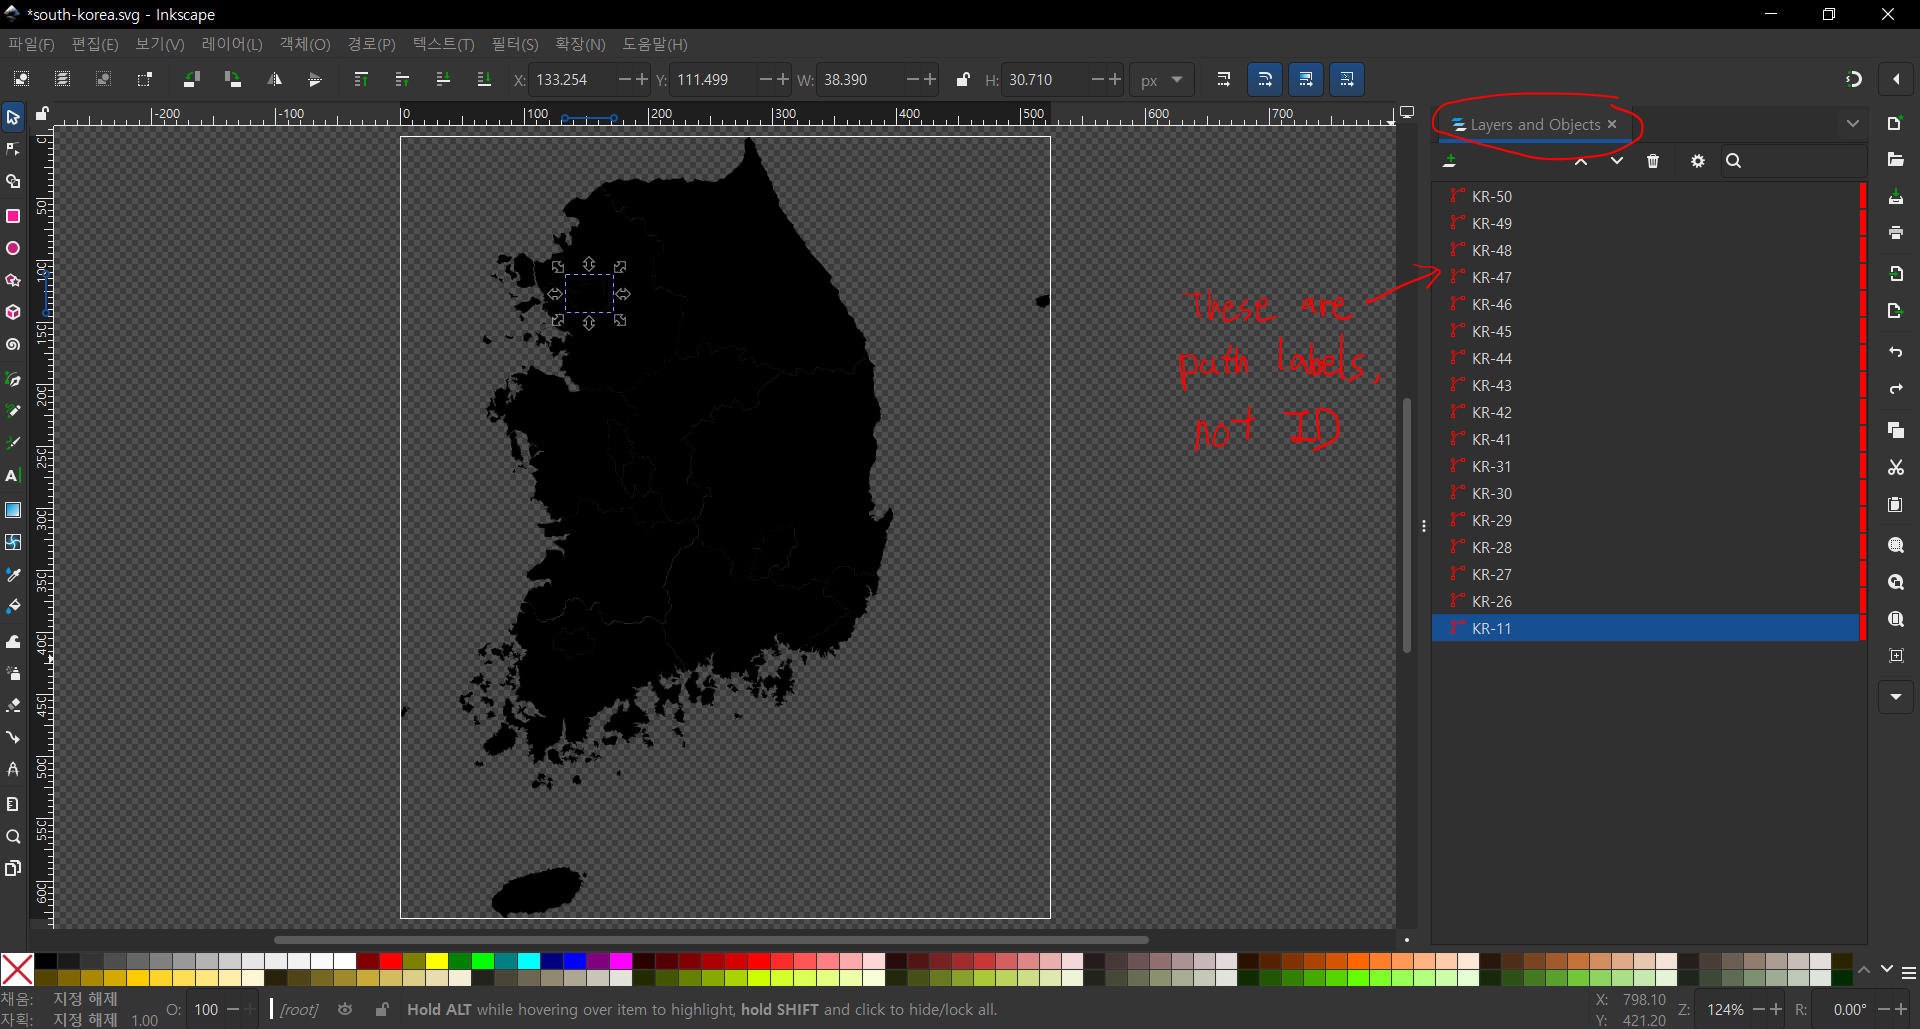
Fortunately, mapsvg provides an SVG file with separate paths!
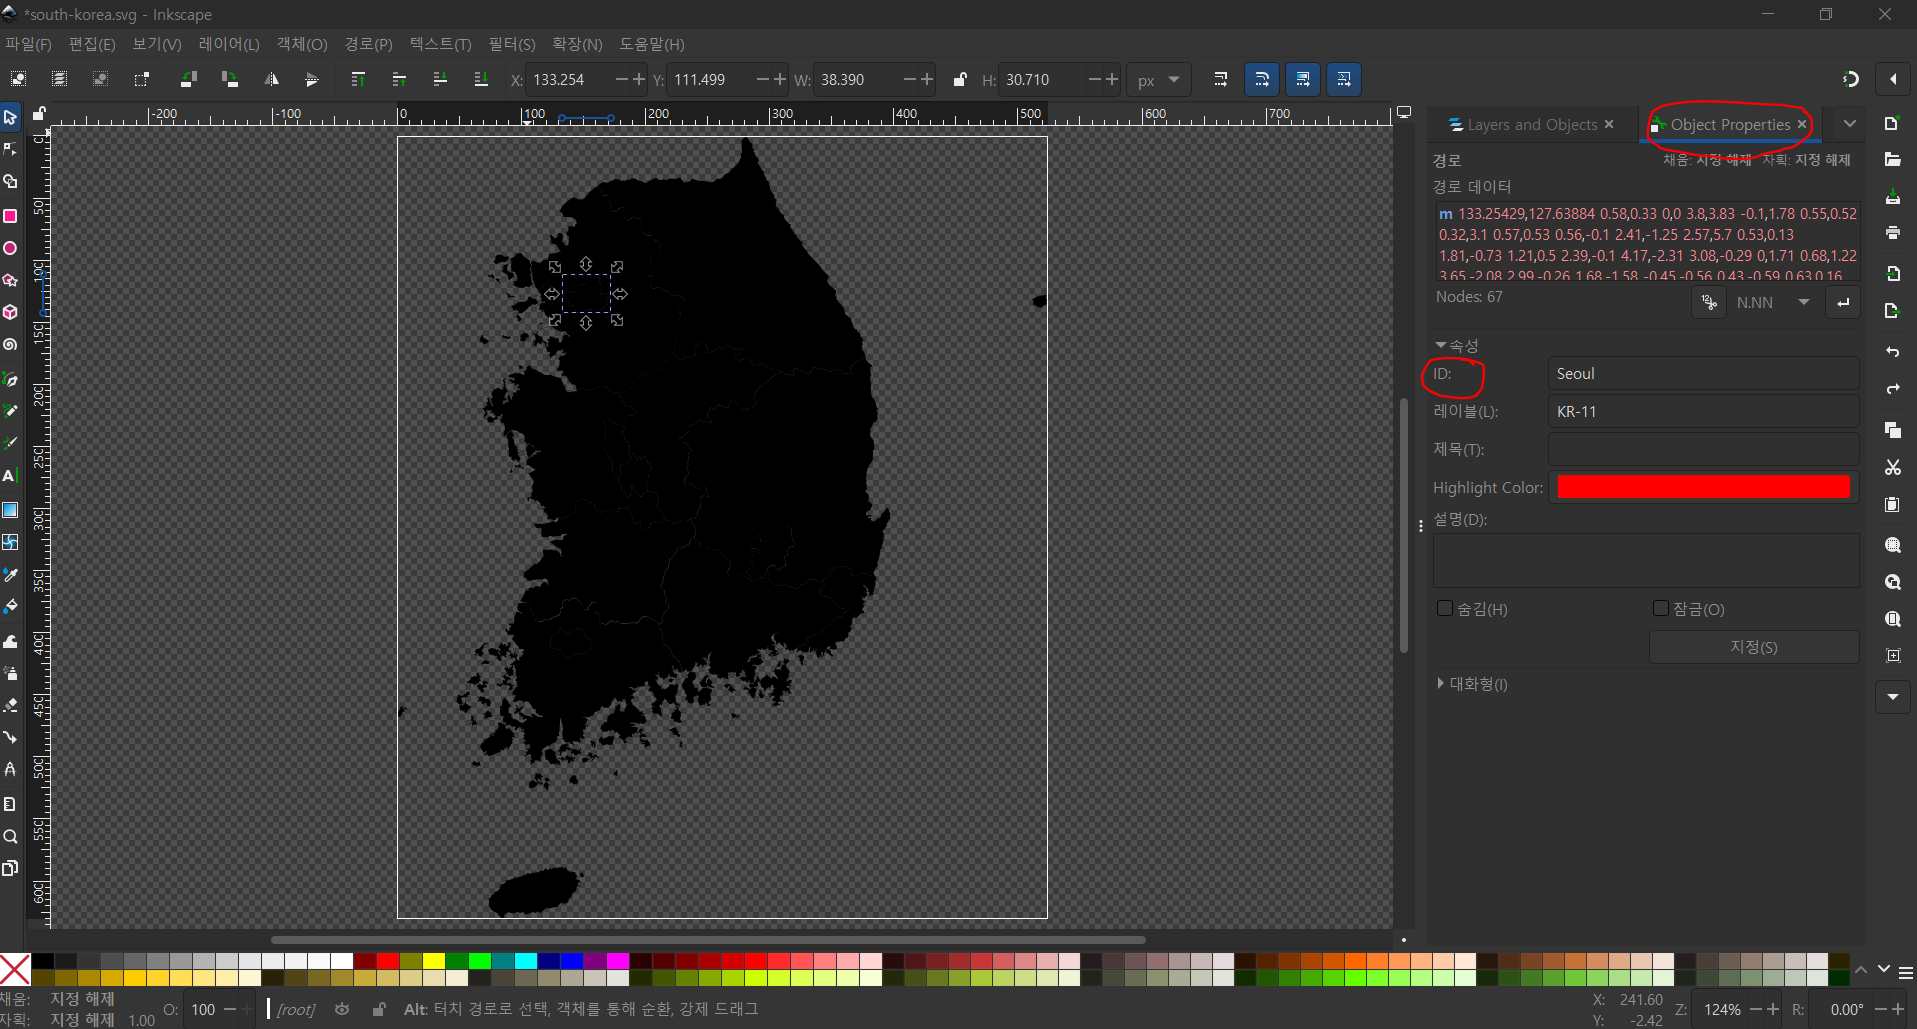
The next step is to assign path IDs in Object Properties.
In R, the package identifies paths by their ID , so it's best to rename them with simple and clear names.
2. Install heatmap.SVG
install.packages("devtools")  # Install devtools if you haven't already
library(devtools)

devtools::install_github("WhiteCoatRabbit/heatmap.SVG")  # Install heatmap.SVG
library(heatmap.SVG)
To install a GitHub package, you'll need devtools first.
Once installed, you don’t need to reinstall it—just load it with library(heatmap.SVG).
3. Read and Check in R
setwd("C:/Users/a/Downloads")  # Set working directory

# Read and check the SVG file
south_korea <- read_n_check("south-korea.svg")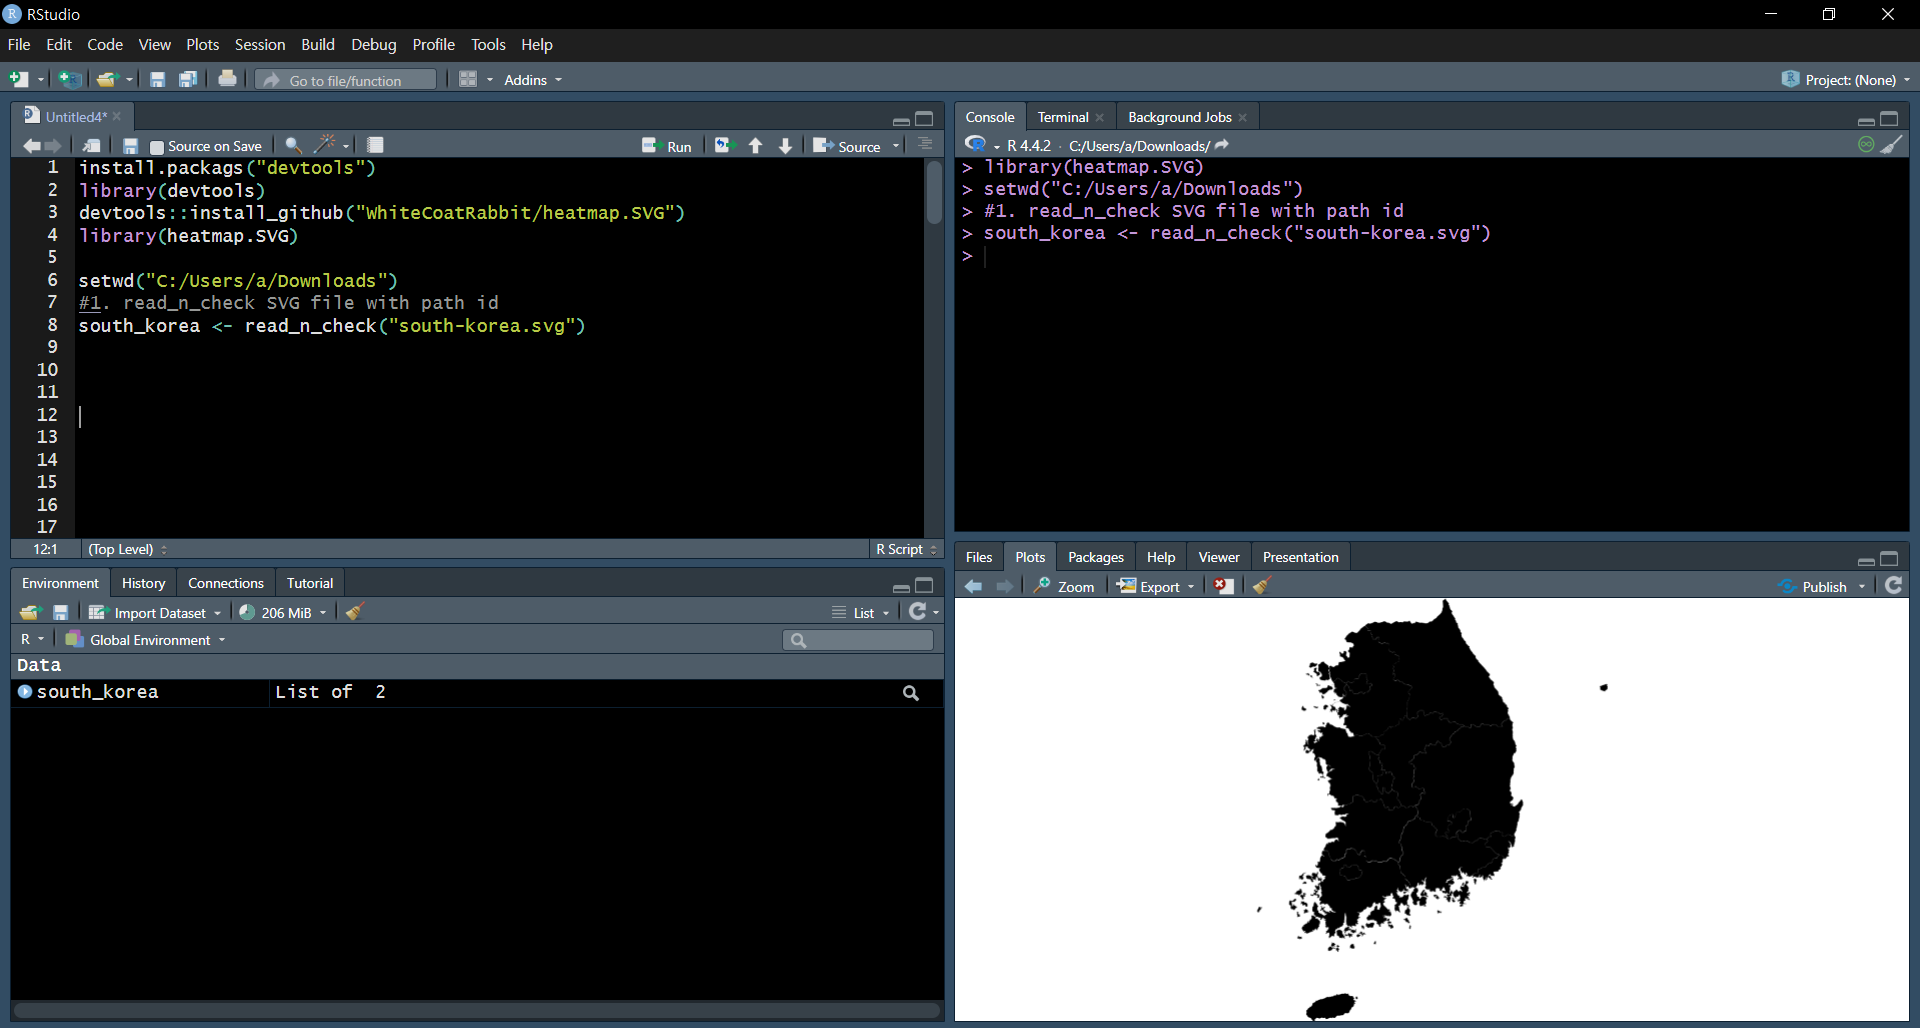
This command does two things: ① Loads the SVG file into R ② Displays the map in the Plots pane
If you set the original SVG's colors as transparent, nothing will be visible.
4. Find path IDs in the SVG file
path_id <- find_path_id(south_korea)
print(path_id)
Enter the data object from read_n_check() into find_path_id().
This will return the path IDs found in the SVG file.
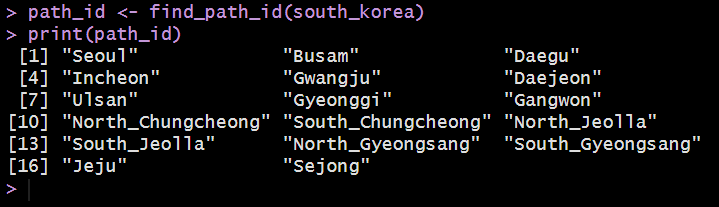
Oh I made typo at Busan.... :(
But never mind; it won’t affect the process!
5. Mapping path IDs to your data
Before mapping, let's first load the population density dataset.
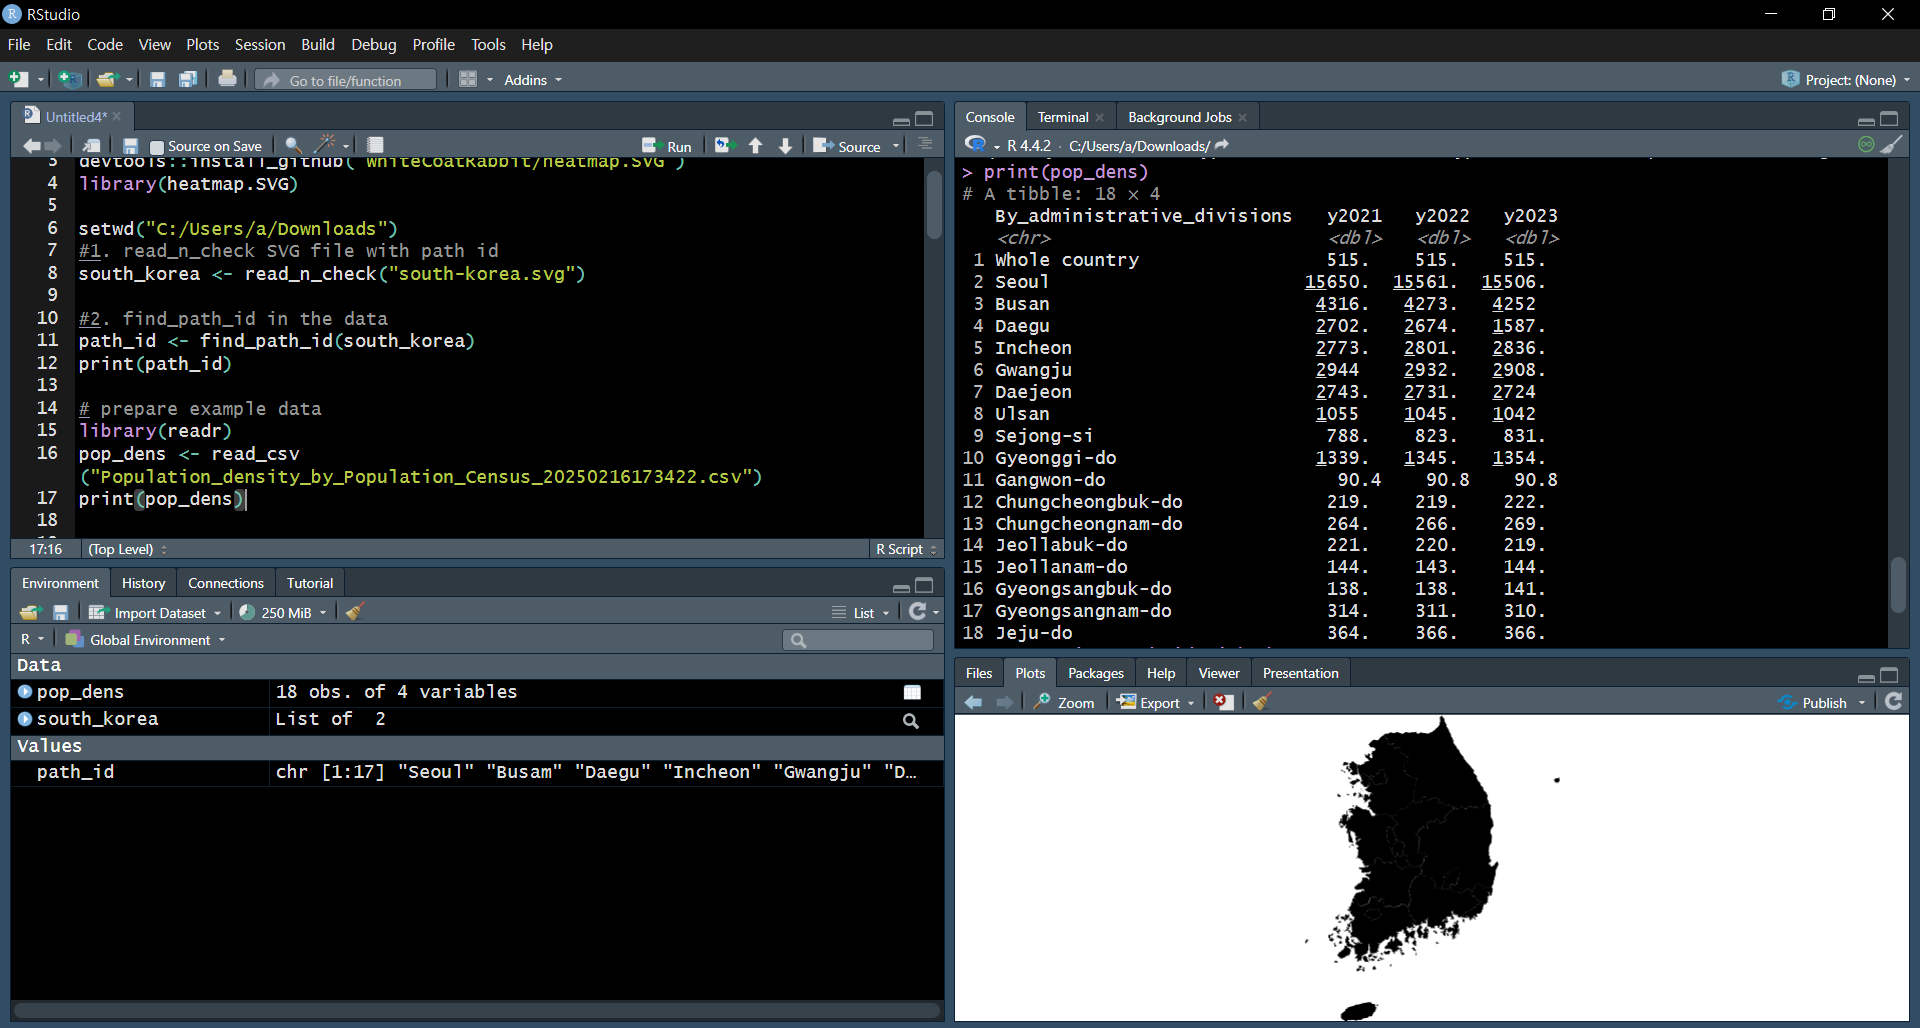
As you can see below, the province names in my data file don't match the path IDs in my SVG file.
For example, my path ID is "North_Jeolla", but in my data file, it is "Jeollabuk-do".
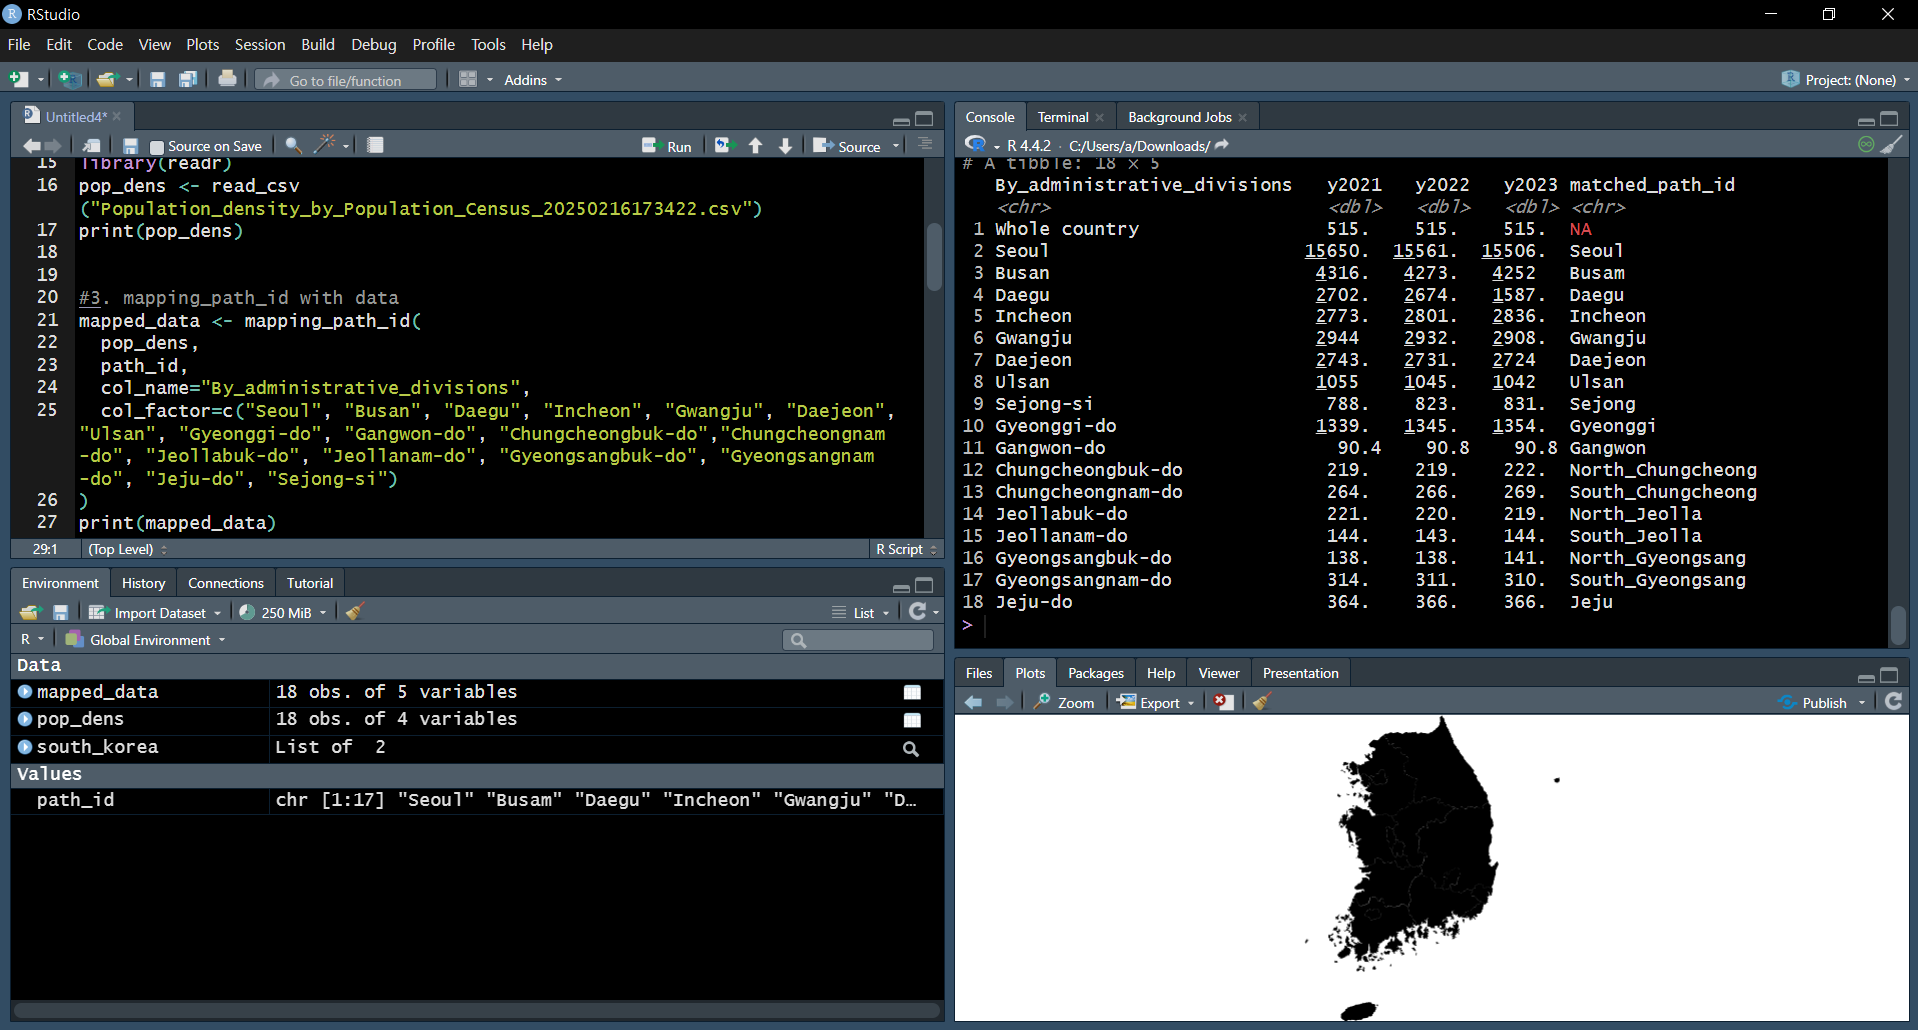
So I'll use mapping_path_id() to align them.
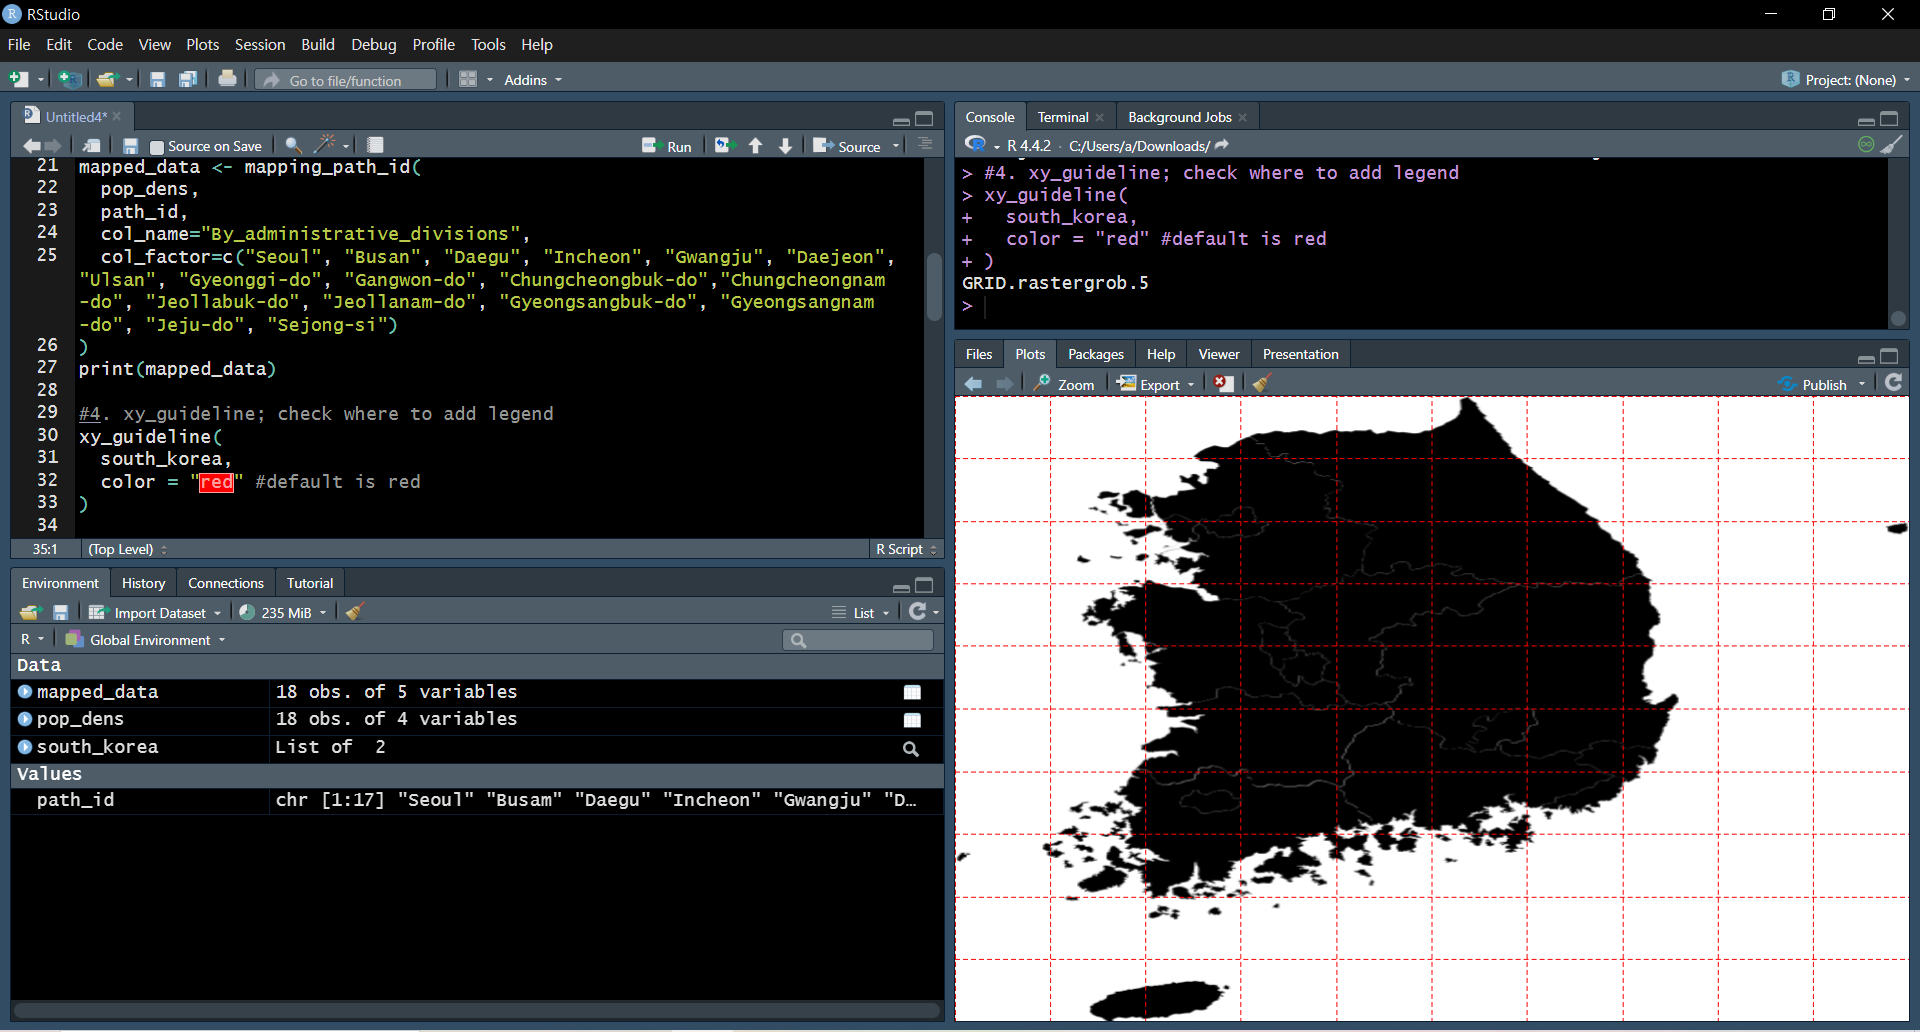
mapped_data <- mapping_path_id(
  pop_dens,  # Your data
  path_id,   # Path IDs from find_path_id()
  col_name = "By_administrative_divisions",  # Column containing province names
  col_factor = c("Seoul", "Busan", "Daegu", "Incheon", "Gwangju", "Daejeon",
                 "Ulsan", "Gyeonggi-do", "Gangwon-do", "Chungcheongbuk-do",
                 "Chungcheongnam-do", "Jeollabuk-do", "Jeollanam-do",
                 "Gyeongsangbuk-do", "Gyeongsangnam-do", "Jeju-do", "Sejong-si")
)
print(mapped_data)
Understanding the Parameters:
① Your dataset
② Path IDs from find_path_id()
③ Column name in your data that corresponds to the path IDs
④ Vector of names in data$col_name (must match path_id order)
6. Make guideline for legend location and size
Before drawing heatmap, let's decide where to place the legend.
Since the legend’s position and size are relative to the original SVG file’s width and height, we should check these values first.
xy_guideline(
  south_korea,
  color = "red" #default color is red
)
This will display 10*10 grid guidelines in the Plots pane.
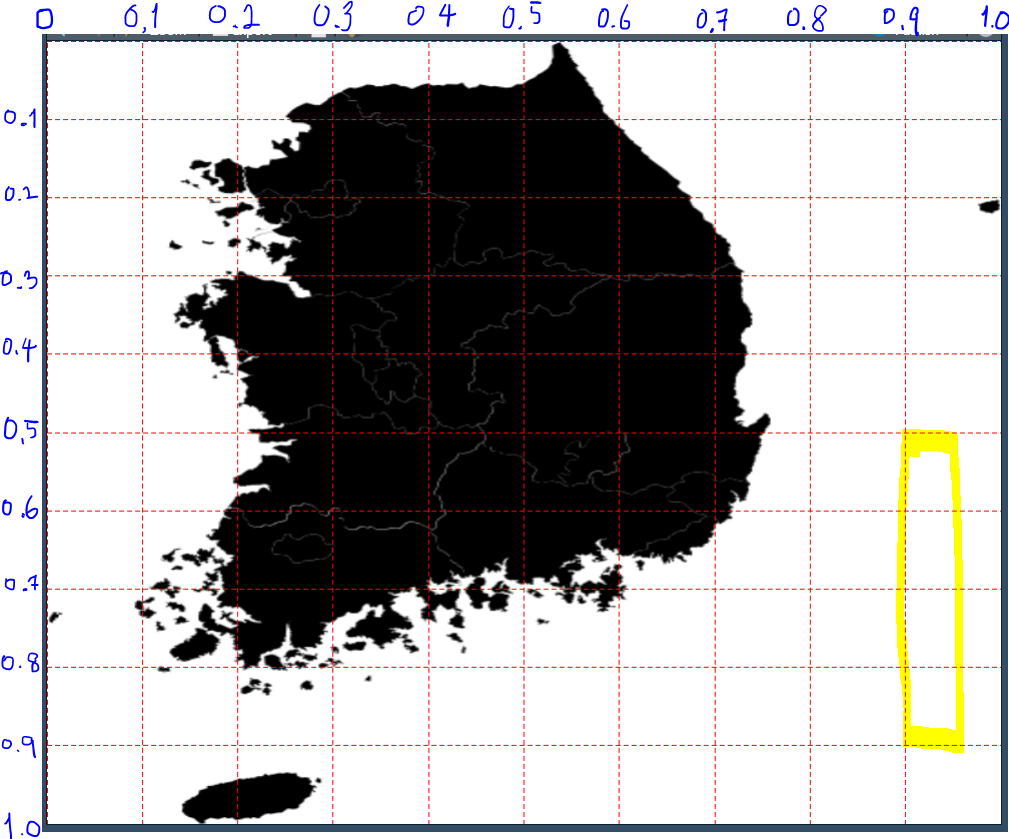
e.g. I want to draw legend in yellow highlighted area,
then the position of rectangle should be 0.9*width, 0.5*height, (the reference point is left upper)
and size should be 0.05*width, 0.4*height.
7. Draw heatmap on SVG file
south_korea_gradient <- heatmapSVG(
  mapped_data,
  south_korea,
  data_col = "y2023",
  id_col = "matched_path_id",
  range = c(90,16000),
  palette = c("white", "yellow", "red"),
  breaks = NULL,
  direction = "vertical",
  position = c(0.9, 0.5),
  size = c(0.05, 0.4),
  label_num = 11,
  save_as = "South_Korea_population_density.svg"
)
save_as saves the output as an SVG file (default is NULL, which just displays it).
You can define custom colors in palette.
Be sure that label_num is not dividing factor (e.g., 0, 10, 20, ..., 100 needs label_num = 11, NOT 10).
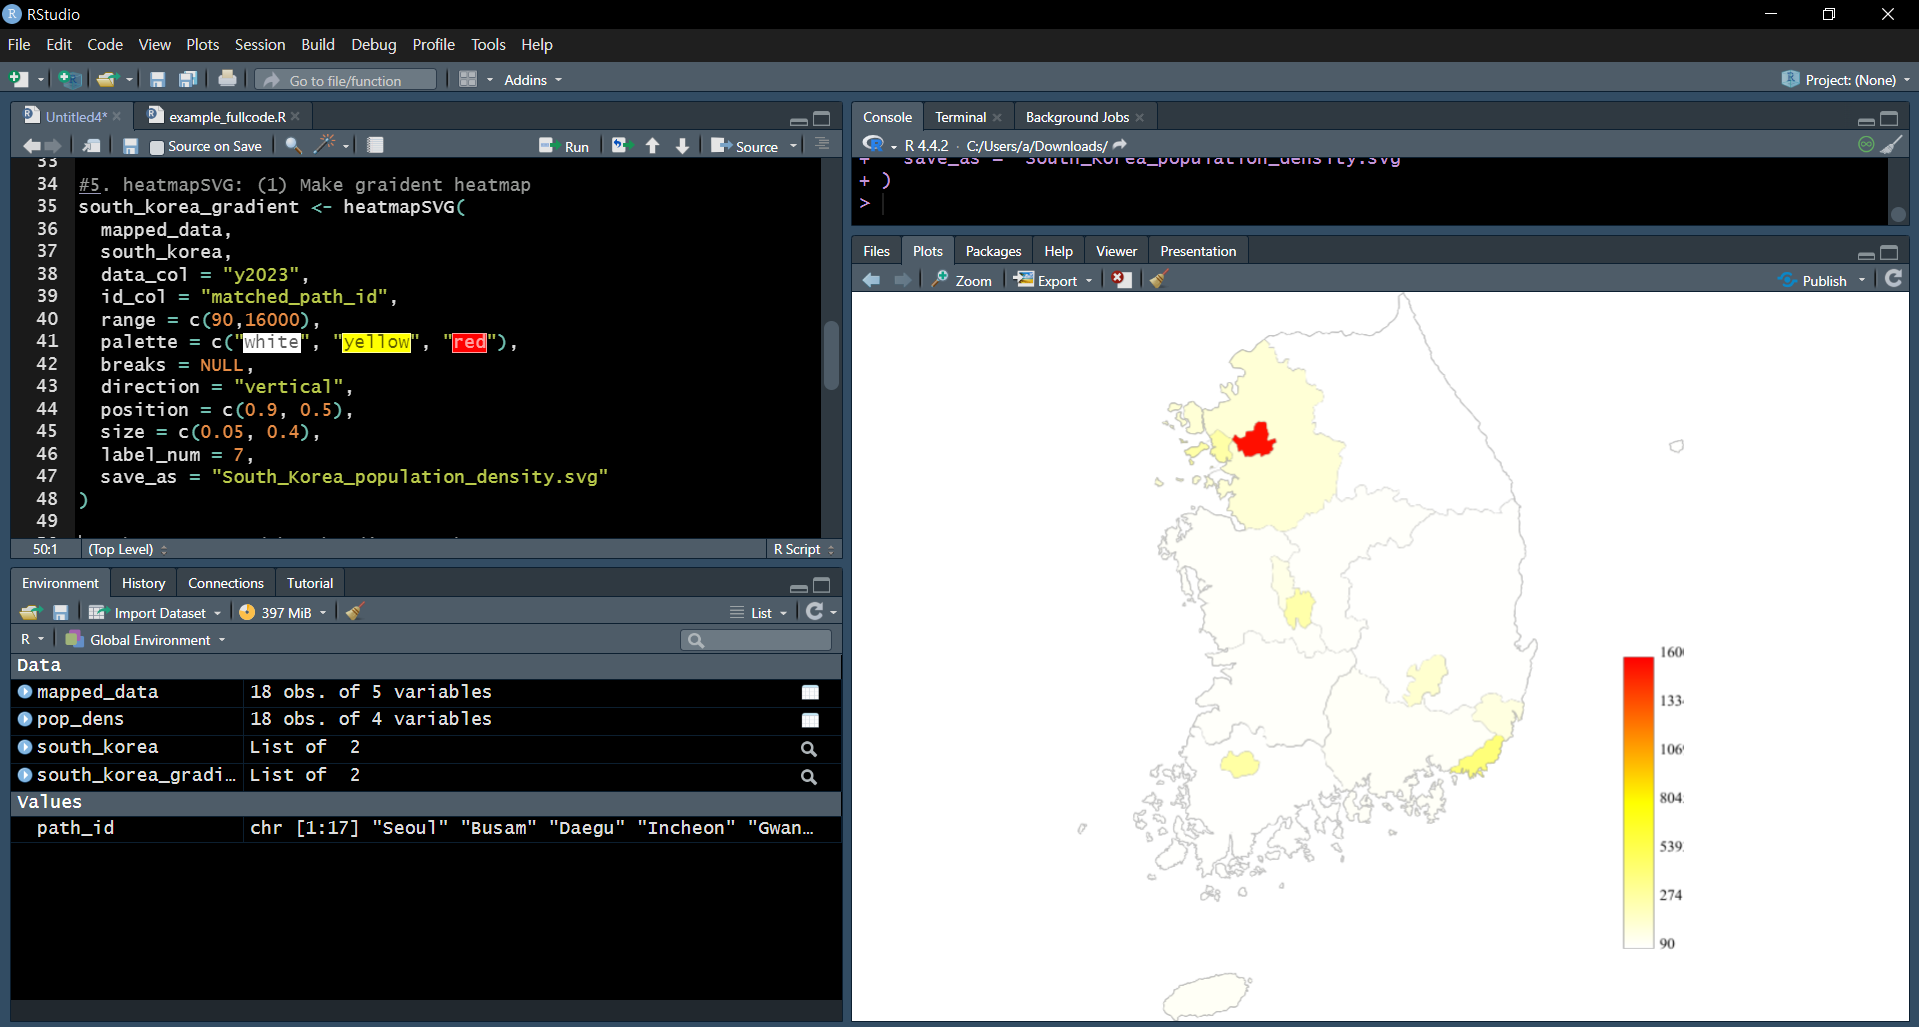
Oh... I don't like the heatmap because it is seoul is outlier...
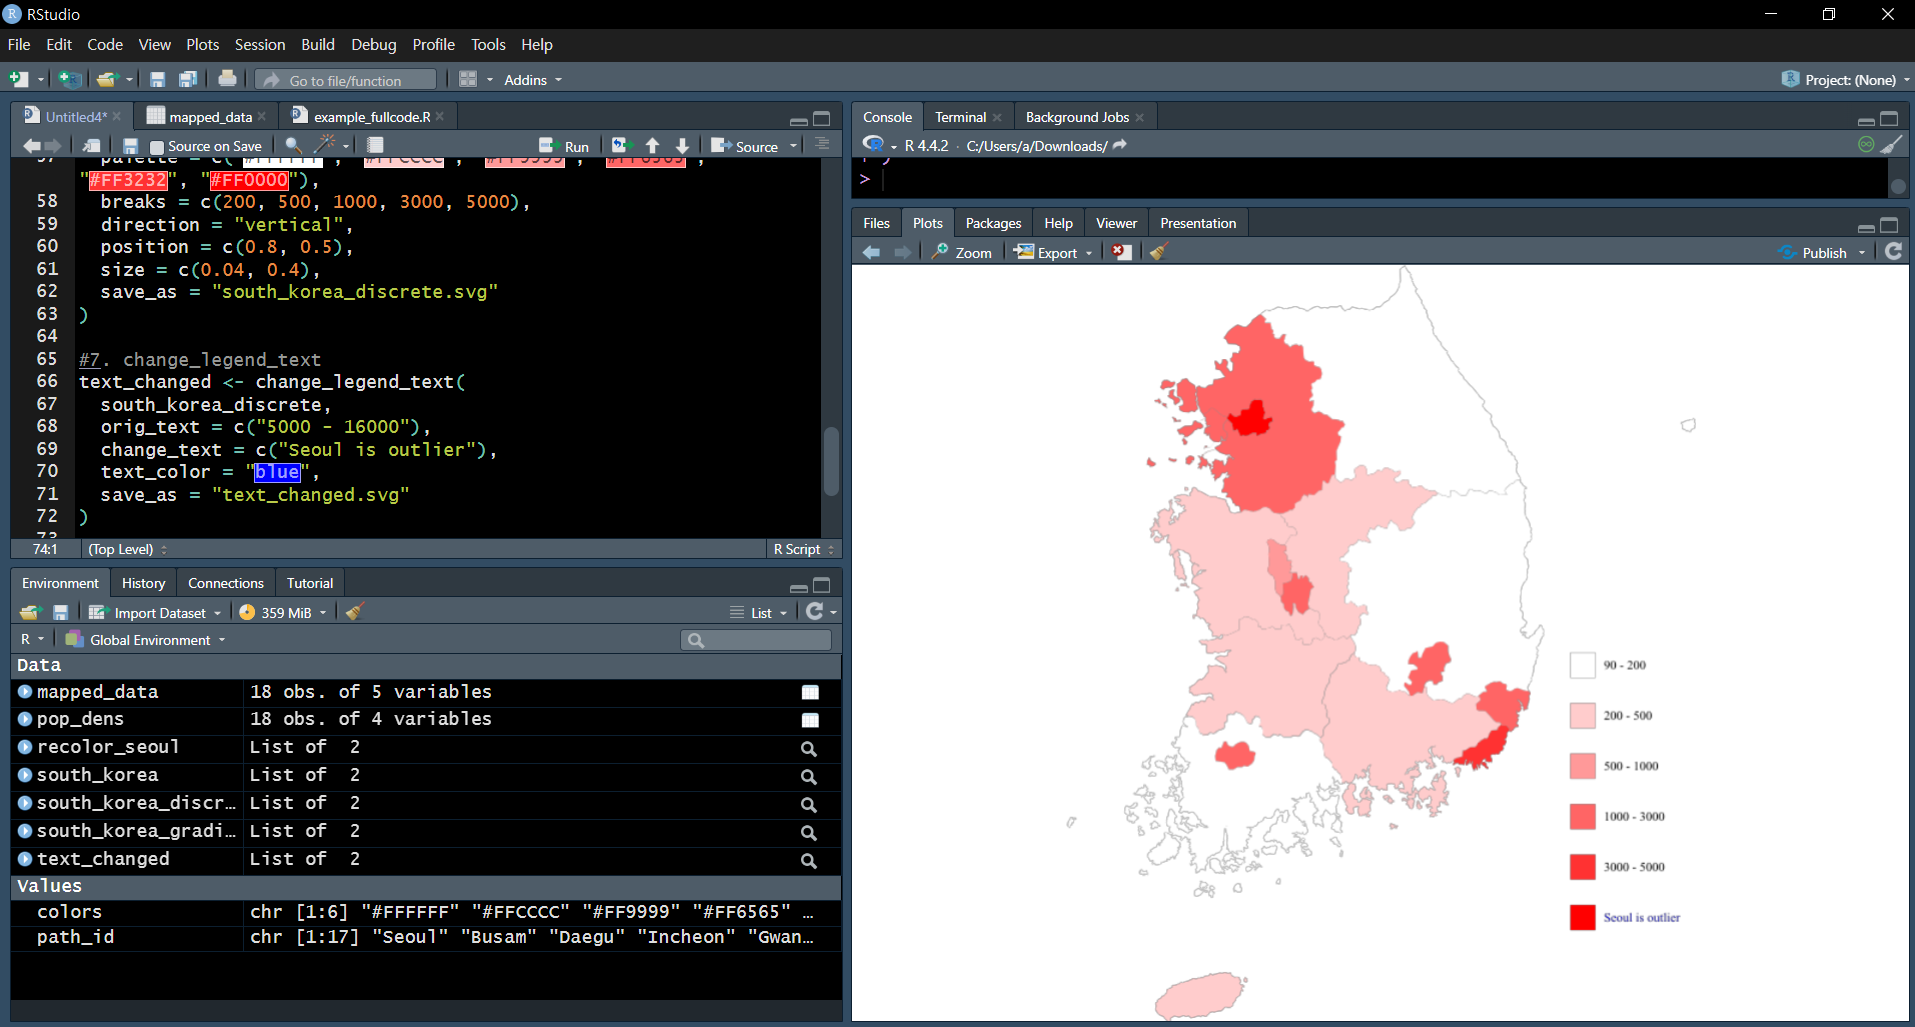
Then you can make discrete heatmap.
Just add breaks as vector.
south_korea_discrete <- heatmapSVG(
  mapped_data,
  south_korea,
  data_col = "y2023",
  id_col = "matched_path_id",
  range = c(90, 16000),
  palette = c("#FFFFFF", "#FFCCCC", "#FF9999", "#FF6565", "#FF3232", "#FF0000"),
  breaks = c(200, 500, 1000, 3000, 5000),
  direction = "vertical",
  position = c(0.8, 0.5),
  size = c(0.04, 0.4),
  save_as = "south_korea_discrete.svg"
)

Be careful about the number of colors and breaks.
If you have 3 breaks, you need 4 colors (number of breaks + 1 = number of colors).
8. Editing Legend Text
text_changed <- change_legend_text(
  south_korea_discrete,
  orig_text = c("5000 - 16000"),
  change_text = c("Seoul is outlier"),
  text_color = "blue",
  save_as = "text_changed.svg"
)
The original text format must match exactly (number + space + hyphen + space + number).
Don't forget spacebar!
Orig_text and Change_text is mandatory, but not text_color.
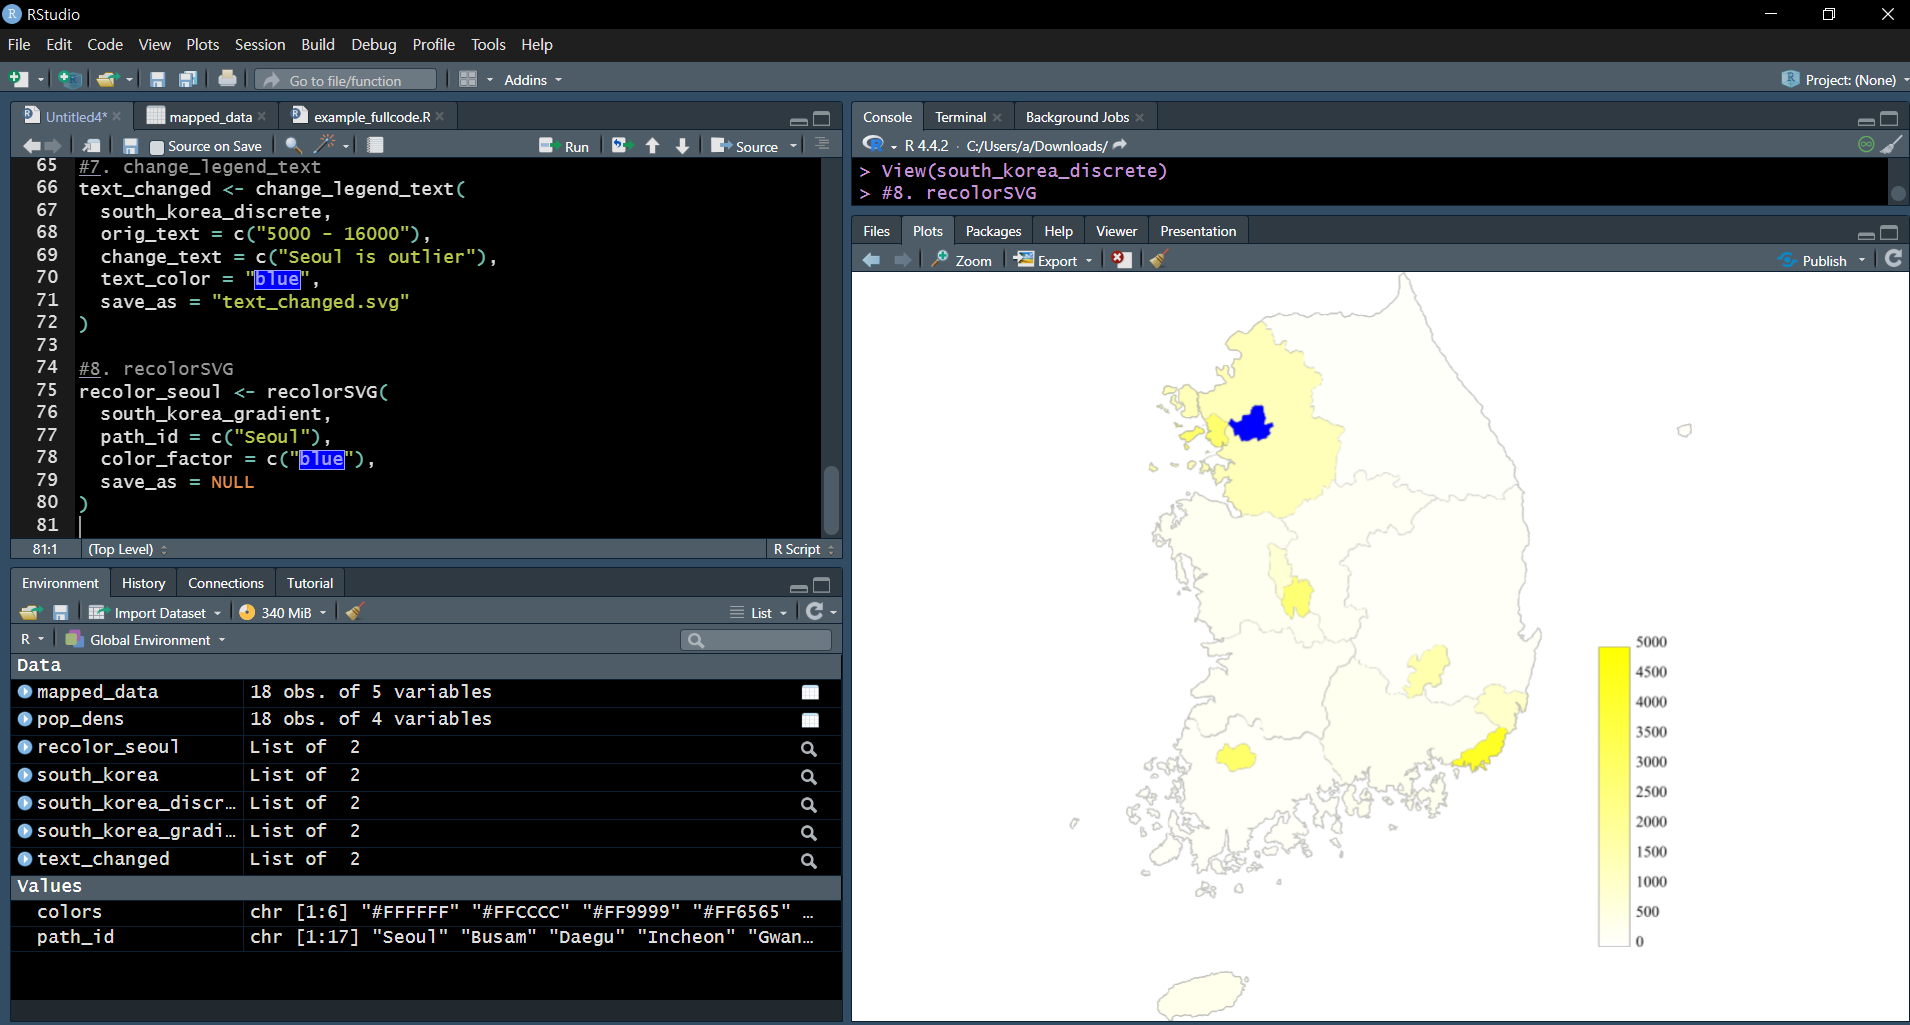
9. Recolor specific path
recolor_seoul <- recolorSVG(
  south_korea_gradient,
  path_id = c("Seoul"),
  color_factor = c("blue"),
  save_as = NULL
)
This allows you to manually change the color of a specific region.
(The number of path_id entries must match the number of color_factor values.)
If you encounter any bugs or have questions, feel free to comment or reach out on GitHub!
This is my first R package, so I apologize in advance for any inconveniences.
I hope this package is helpful!
Thank you!